The ARM cloud scene just got more interesting with Scaleway’s announcement of their new ARMv8 product.
We wanted to have a quick look at the performance of those ARM cores, so we spun up a node and poked around. Here’s what we found.
The 4-core ARM Server
Scaleway’s “ARM64-4GB” is based on the ThunderX ARMv8 SoC from Cavium, and comes with 4 cores and 4GB RAM. From the UI, only Ubuntu 16.04 and Debian 8 images appear to be available.
Packet.net’s Type 2A ARMv8 servers also use Cavium ThunderX processors.
We spun up one of these and installed the OpsDash Smart Agent which is also available for monitoring ARMv8 platforms. Here’s the default dashboard for the instance:
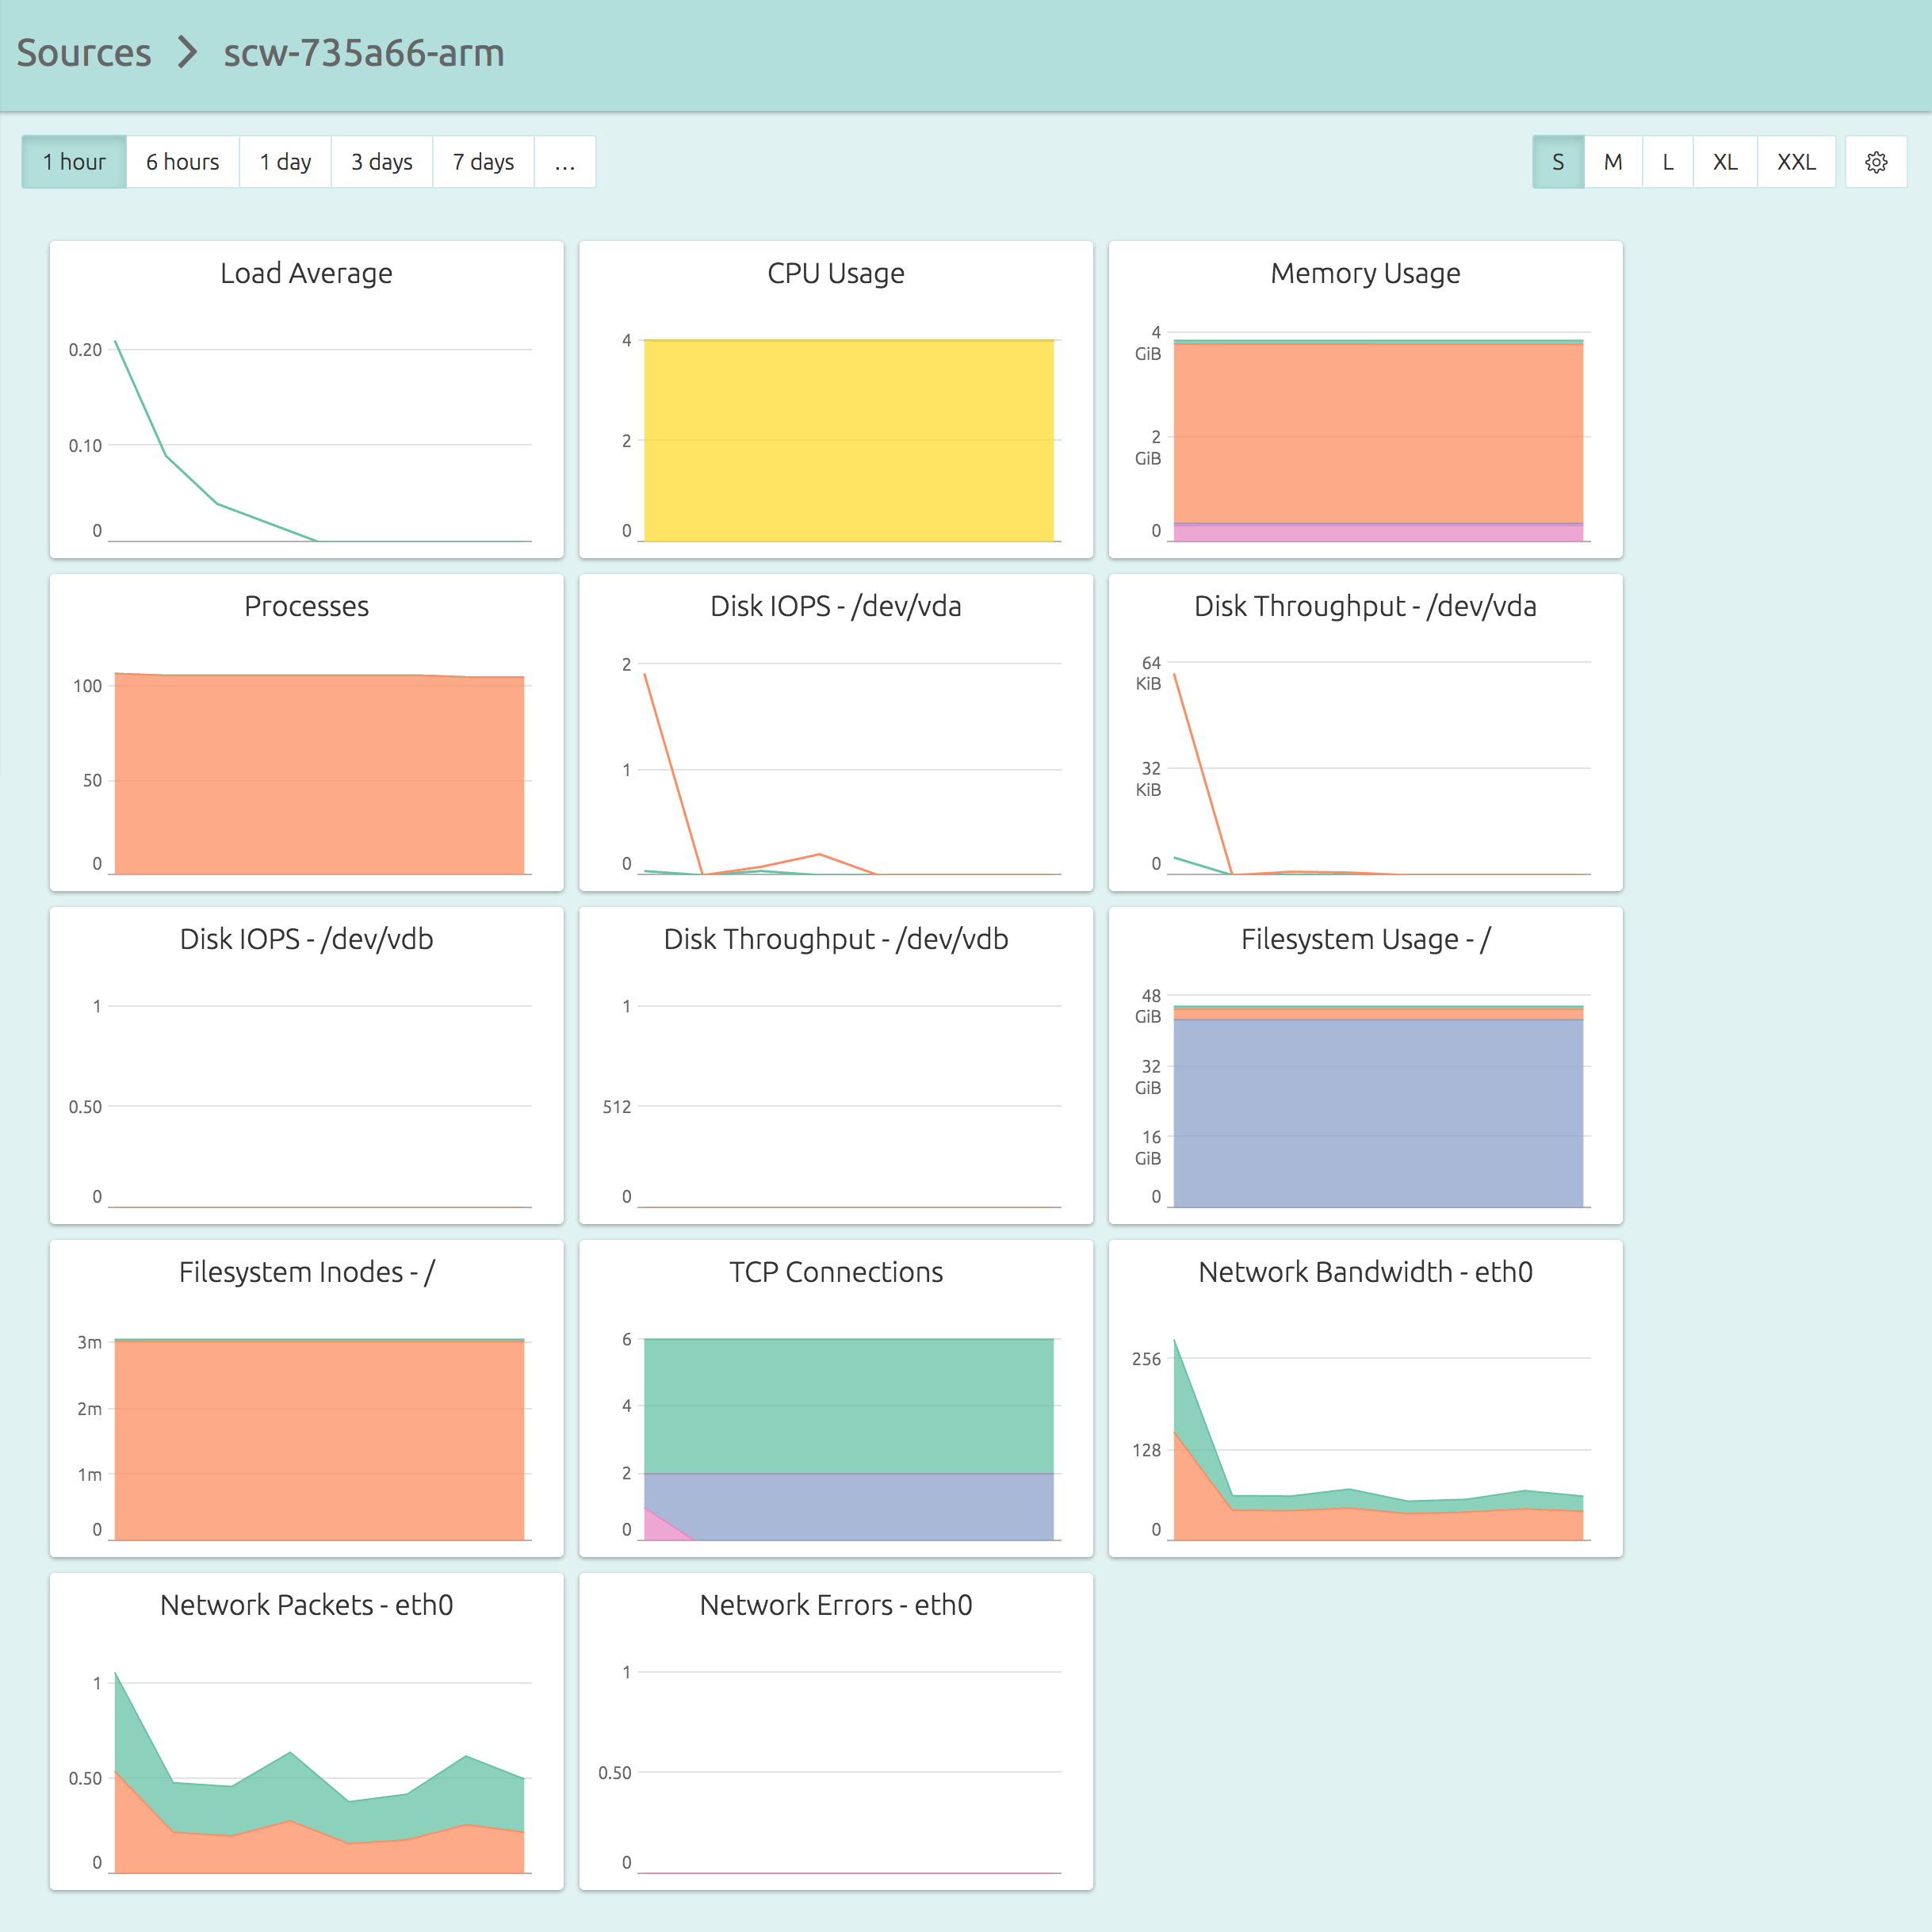
You can see that the bundled 100GB SSD disk comes as two separate block devices.
Running a Benchmark
We ran a simple CPU benchmark, stressing all the cores:
root@scw-735a66-arm:~# sysbench --test=cpu --cpu-max-prime=100000 --num-threads=4 run
sysbench 0.4.12: multi-threaded system evaluation benchmark
Running the test with following options:
Number of threads: 4
Doing CPU performance benchmark
Threads started!
Done.
Maximum prime number checked in CPU test: 100000
Test execution summary:
total time: 65.2214s
total number of events: 10000
total time taken by event execution: 260.8059
per-request statistics:
min: 25.74ms
avg: 26.08ms
max: 58.11ms
approx. 95 percentile: 26.58ms
Threads fairness:
events (avg/stddev): 2500.0000/2.74
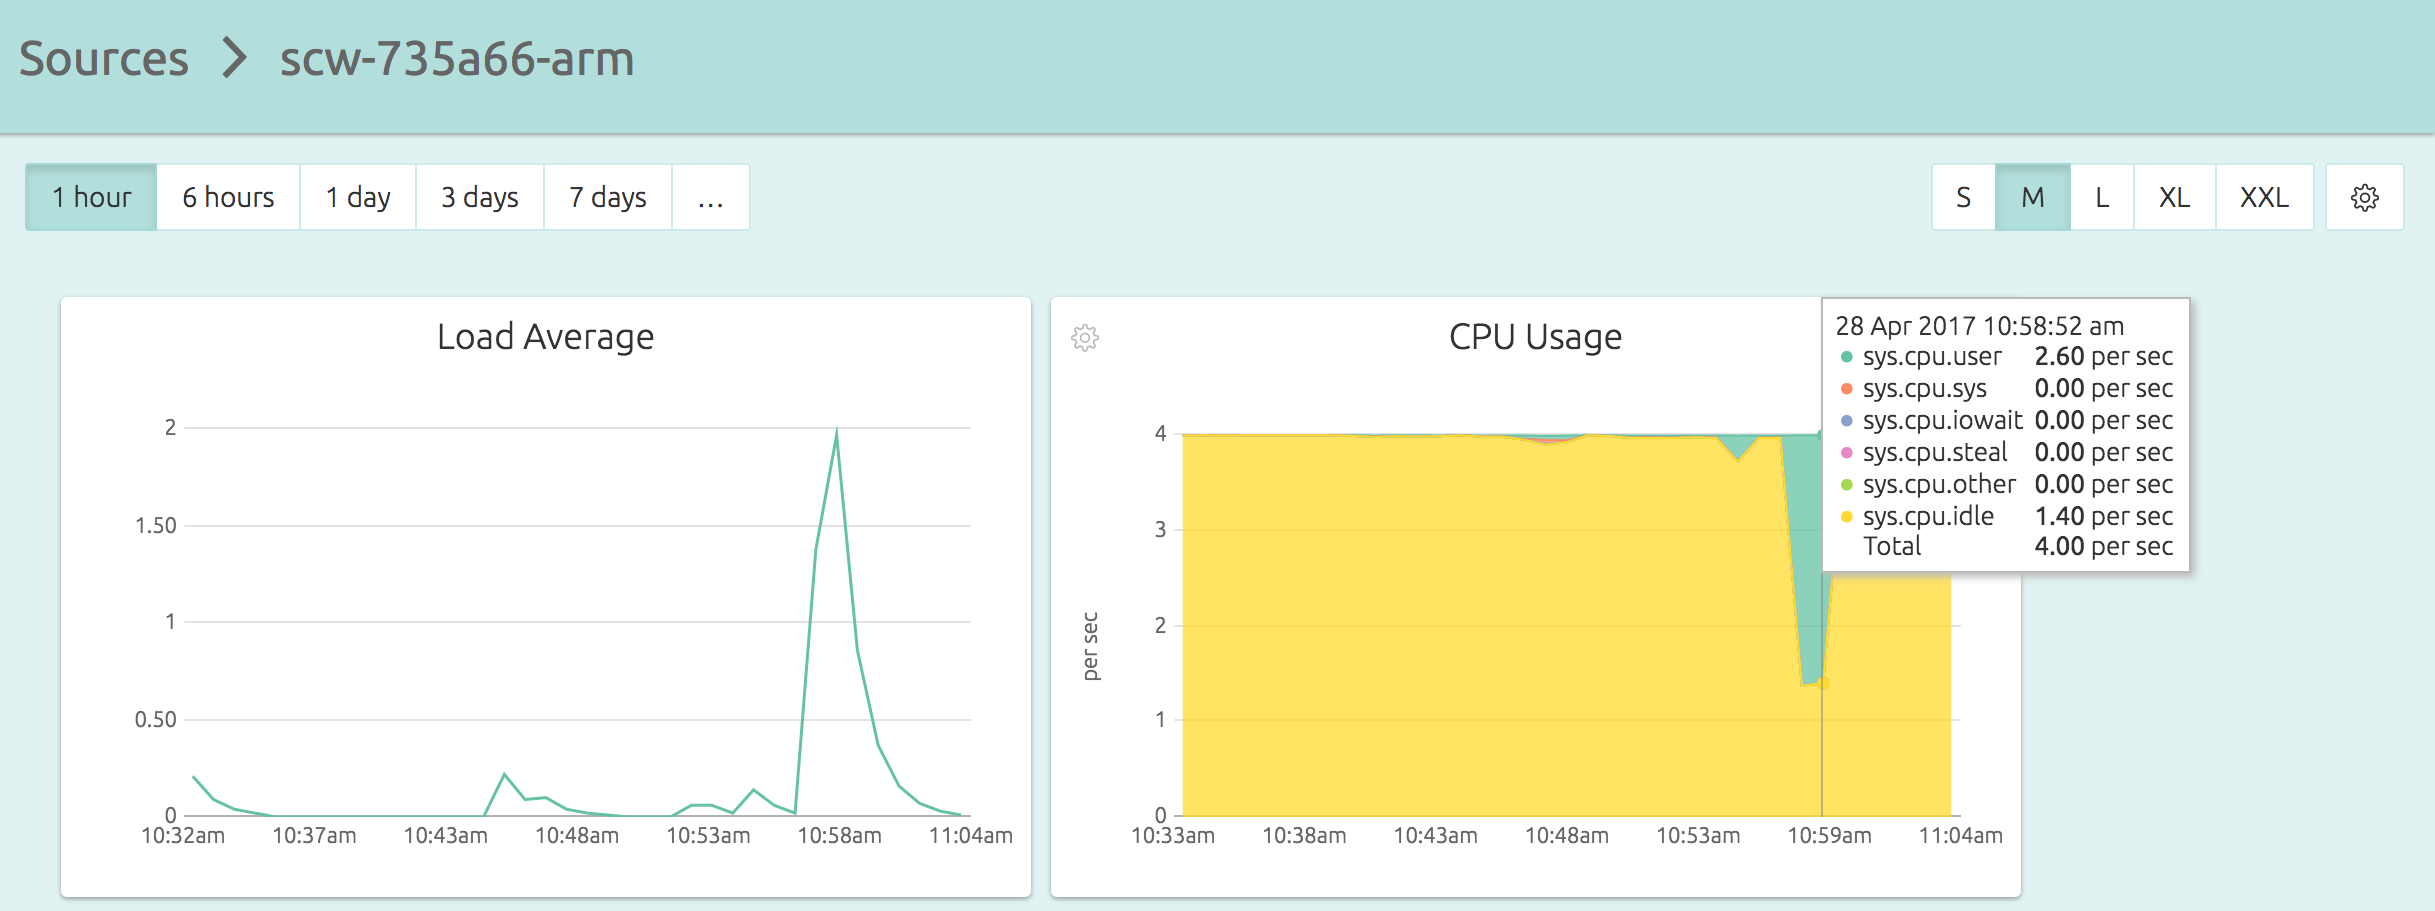
execution time (avg/stddev): 65.2015/0.00The total time was 65.2214s. Considering what is coming up next, that is impressive! Here is how the graphs looked during the execution:
The 4-Core Intel SoC
Since Scaleway also has a “VC1M” product with the same RAM and same number of cores but running on Intel Atom C2750, we were curious as to what numbers that would have. We spun up a VC1M node:
root@scw-383195-x86:~# cat /proc/cpuinfo | grep 'model name'
model name	: Intel(R) Atom(TM) CPU  C2750  @ 2.40GHz
model name	: Intel(R) Atom(TM) CPU  C2750  @ 2.40GHz
model name	: Intel(R) Atom(TM) CPU  C2750  @ 2.40GHz
model name	: Intel(R) Atom(TM) CPU  C2750  @ 2.40GHz
and tried the same benchmark:
root@scw-383195-x86:~# sysbench --test=cpu --cpu-max-prime=100000 --num-threads=4 run
sysbench 0.4.12:  multi-threaded system evaluation benchmark

Running the test with following options:
Number of threads: 4

Doing CPU performance benchmark

Threads started!
Done.

Maximum prime number checked in CPU test: 100000


Test execution summary:
    total time:                          105.6248s
    total number of events:              10000
    total time taken by event execution: 422.4050
    per-request statistics:
         min:                                 41.94ms
         avg:                                 42.24ms
         max:                                 85.87ms
         approx.  95 percentile:              42.92ms

Threads fairness:
    events (avg/stddev):           2500.0000/5.39
    execution time (avg/stddev):   105.6013/0.01
This took more time, clocking in at 105.6248s, a good bunch more than the ARM server.
Which made us even more curious – what numbers would we get on DigitalOcean and Vultr?
A 4-core DigitalOcean Node
So we spun up a 4-core server on DigitalOcean that comes with 8GB RAM. Here’s
what /proc/cpuinfo said:
root@do-4core:~# cat /proc/cpuinfo | grep 'model name'
model name	: Intel(R) Xeon(R) CPU E5-2650L v3 @ 1.80GHz
model name	: Intel(R) Xeon(R) CPU E5-2650L v3 @ 1.80GHz
model name	: Intel(R) Xeon(R) CPU E5-2650L v3 @ 1.80GHz
model name	: Intel(R) Xeon(R) CPU E5-2650L v3 @ 1.80GHz
Again, we ran the same benchmark:
root@do-4core:~# sysbench --test=cpu --cpu-max-prime=100000 --num-threads=4 run
sysbench 0.4.12:  multi-threaded system evaluation benchmark

Running the test with following options:
Number of threads: 4

Doing CPU performance benchmark

Threads started!
Done.

Maximum prime number checked in CPU test: 100000


Test execution summary:
    total time:                          89.1095s
    total number of events:              10000
    total time taken by event execution: 356.3826
    per-request statistics:
         min:                                 34.32ms
         avg:                                 35.64ms
         max:                                 90.34ms
         approx.  95 percentile:              38.19ms

Threads fairness:
    events (avg/stddev):           2500.0000/9.97
    execution time (avg/stddev):   89.0956/0.01
And we have a time of 89.1095s for this one.
Vultr
Vultr offers a 4-core VM with 8GB RAM. The VMs do not expose the physical CPU model or make, although they are Intel 64-bits. Here’s the sysbench result:
root@vultr-4core:~# sysbench --test=cpu --cpu-max-prime=100000 --num-threads=4 run
sysbench 0.4.12:  multi-threaded system evaluation benchmark

Running the test with following options:
Number of threads: 4

Doing CPU performance benchmark

Threads started!
Done.

Maximum prime number checked in CPU test: 100000


Test execution summary:
    total time:                          68.7910s
    total number of events:              10000
    total time taken by event execution: 275.0976
    per-request statistics:
         min:                                 26.70ms
         avg:                                 27.51ms
         max:                                 53.51ms
         approx.  95 percentile:              28.54ms

Threads fairness:
    events (avg/stddev):           2500.0000/11.64
    execution time (avg/stddev):   68.7744/0.01
That’s 68.7910s.
Parting Thoughts
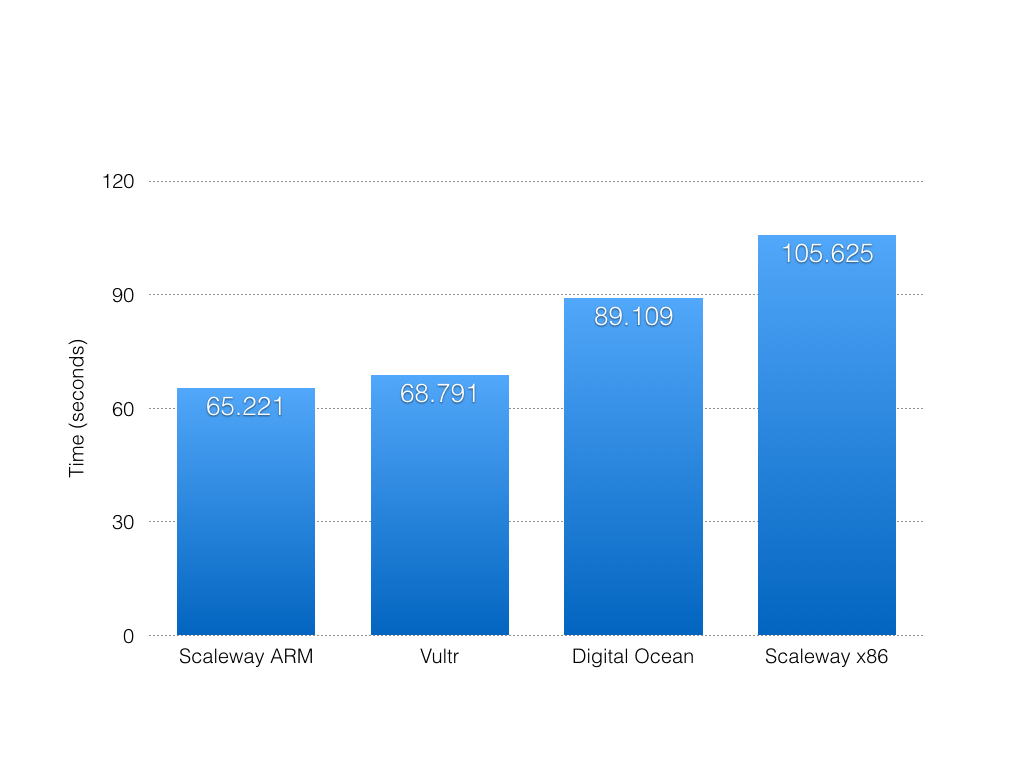
This was not a very scientific test, just a quick comparison of a new product. However, the results are quite interesting, especially considering that the prices for the products in this chart vary from €5.99 to $80 per month!
We are excited by the expanding ARM cloud offerings, and especially the way it’s introducing different price ratios for CPU and RAM. Maybe we’re seeing the beginning of hybrid-architecture cloud deployments? Interesting times!
New Here?
OpsDash can be used to monitor ARMv6, ARMv7, and ARMv8 infrastructure. Monitor your Scaleway or Packet setup or even your own Raspberry Pi. Signup for an OpsDash Free Trial to check it out!
OpsDash is a server monitoring, service monitoring, and database monitoring solution for monitoring MySQL, PostgreSQL, MongoDB, memcache, Redis, Apache, Nginx, Elasticsearch and more. It provides intelligent, customizable dashboards and spam-free alerting via email, HipChat, Slack, PagerDuty and Webhooks. Send in your custom metrics with StatsD and Graphite interfaces built into each agent.